Problem set 9: Plotting functions
This assignment is due on Wednesday, April 2 at 11:59pm. Submit it using Handin as assignment ps9. Corrections can be presented until Friday, April 25.
This problem set builds on the skills that we introduced in Lectures 2−9 and 11−18. To encourage you to review those lectures, your grade on this assignment will be capped by your grade on those lectures. You can resubmit lecture exercises at any time.
Study tip: To do this problem set, you only need to know what we teach before the second midterm. In fact, doing this problem set is a great way to prepare for the second midterm.

Remember to follow the design recipe for each function, even if defined locally. In particular, every type mentioned in a signature must be introduced by a data definition, except for these well-known types: Number, Image, String, Color, Boolean, KeyEvent, MouseEvent, Posn, Anything, NaturalNumber, ListOfNumbers, 1String, [ListOf X], [NEListOf X].
Note: Use the “Intermediate Student with lambda” language on this and further assignments in this course.
1 Converting numbers
; convert : Number Number Number Number Number -> Number ; if a1 becomes b1 and a2 becomes b2, then what should a become?
;
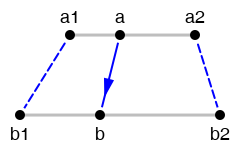
; *Assumption*: a1 and a2 are different (check-expect (convert 0 32 100 212 0) 32) (check-expect (convert 0 32 100 212 100) 212) (check-expect (convert 0 32 100 212 50) 122) (define (convert a1 b1 a2 b2 a) (/ (+ (* b1 (- a2 a)) (* b2 (- a a1))) (- a2 a1)))
Exercise 1. Design a function celsius->fahrenheit which takes a temperature in Celsius and returns a number in Fahrenheit.
Do not use any arithmetic operations such as + - * /. Instead, use convert.
Hint: To use convert, you only need to pay attention to its signature, purpose, and examples. You don’t need to look at its definition. If you’re not sure what convert does, study the three examples we provide above, and plug their inputs into the purpose statement we provide above. For example, (convert 0 32 100 212 50) answers this question: if 0 becomes 32 and 100 becomes 212, then what should 50 become?
Exercise 2. Design a function number-between-20-and-180 that takes a number n between 0 and 100 as input and answers this question: Imagine you are walking on the number line from the number 20 to the number 180. Where are you after going n% of the way?
Do not use any arithmetic operations such as + - * /. Instead, use convert.
Hint: If you’re not sure what convert does, plug more inputs into the purpose statement we provide above. For example, (convert 0 20 100 180 50) answers this question: if 0 becomes 20 and 100 becomes 180, then what should 50 become?
Exercise 3. Design a function fahrenheit->celsius which takes a temperature in Fahrenheit and returns a number in Celsius.
Do not use any arithmetic operations such as + - * /. Instead, use convert.
Hint: If you’re not sure what convert does, plug more inputs into the purpose statement we provide above. For example, (convert 32 0 212 100 50) answers this question: if 32 becomes 0 and 212 becomes 100, then what should 50 become?
2 Plotting posns
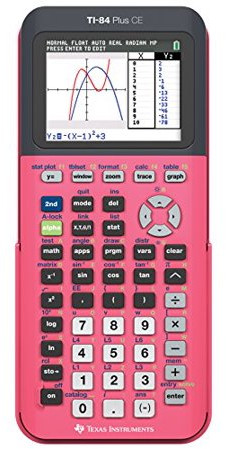
In the remainder of this assignment, you will develop a program that plots the graph of a function and lets the user move around and zoom in and out, like a graphing calculator does.
Exercise 4. Define constants width and height which will be used to determine the width and height of the scene. Using build-list, define my-points to be a long list of posns of your making.
Hint: To recall how to use build-list, study the build-list section of Lecture 19: Using built-in abstractions. Also, study the signature and purpose in Figure 95 of the textbook. There, N means NaturalNumber. But what is X?
Exercise 5. Design a function visible which takes a list of posns and returns the list of all the given posns whose x coordinate is between 0 and width (inclusive) and whose y coordinate is between 0 and height (inclusive). Use filter.
Hint: To recall how to use filter, study Lab 9: Built-in abstractions. Also, study the signature and purpose in Figure 95 of the textbook. What is X?
(define my-plot (draw-lop my-points))
Hint: To recall how to use foldr, review Lecture 17: Built-in abstractions. Also, study the signature and purpose in Figure 96 of the textbook. What is X and what is Y?
3 Converting places
This section is optional (even for H211 students), and you don’t need to submit anything, but it may help you do the next section.
(define wells-library (make-posn -86.5170 39.1710)) (define sample-gates (make-posn -86.5270 39.1665)) (define courthouse (make-posn -86.5340 39.1670)) (define stadium (make-posn -86.5255 39.1810)) (define college-mall (make-posn -86.4955 39.1615)) (define bloomington-places (list wells-library sample-gates courthouse stadium college-mall))
So, to make a picture of bloomington-places, we have to first convert the longitudes and latitudes into screen coordinates suitable for draw-lop.
; bloomington-x->screen : Number -> Number ; turn a longitude in Bloomington into an X on screen (check-expect (bloomington-x->screen -86.5725) 0) (check-expect (bloomington-x->screen -86.5225) (/ width 2)) (check-expect (bloomington-x->screen -86.4725) width)
; bloomington-y->screen : Number -> Number ; turn a latitude in Bloomington into an Y on screen (check-expect (bloomington-y->screen 39.1150) height) (check-expect (bloomington-y->screen 39.1650) (/ height 2)) (check-expect (bloomington-y->screen 39.2150) 0)
; bloomington->screen : Posn -> Posn ; turn Bloomington coordinates into screen coordinates (check-expect (bloomington->screen wells-library) (make-posn (* 0.555 width) (* 0.440 height))) (check-expect (bloomington->screen sample-gates) (make-posn (* 0.455 width) (* 0.485 height)))
4 Converting coordinates
In this assignment, the word graph will refer to a list of posns (like bloomington-places) obtained from a given function f. The x field of each posn will store an x-value. The y field of each posn will store the value of f evaluated at the number stored in the x field. By drawing or plotting, we mean producing an image from the graph of a function.
The data contained in a graph will be interpreted as points in a Cartesian coordinate system. The goal of this section is to relate lists of posns interpreted in a Cartesian coordinate system to lists of posns interpreted in the coordinate system of a DrRacket image. In this way, we will not just show a fixed image, but let the user move and zoom the view of the function.
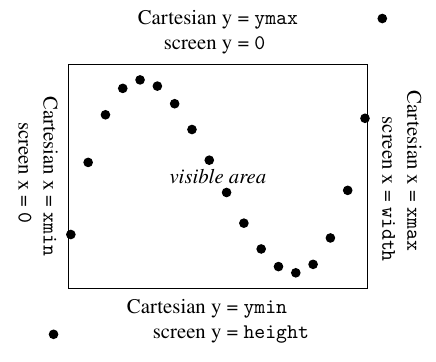
; A World is (make-world Number Number Number Number) ; *Interpretation*: ; xmin is the Cartesian x coordinate of the left edge of the view ; xmax is the Cartesian x coordinate of the right edge of the view ; ymin is the Cartesian y coordinate of the BOTTOM edge of the view ; ymax is the Cartesian y coordinate of the TOP edge of the view (define-struct world [xmin xmax ymin ymax])
(define bloomington-view (make-world -86.5725 -86.4725 39.1150 39.2150))
Exercise 7. Design a function cartesian->screen which takes a World and a list of posns and returns a list of posns. Use map and convert; do not use any arithmetic operations such as + - * /.
(check-expect (cartesian->screen bloomington-view bloomington-places) (list (make-posn (* 0.555 width) (* 0.440 height)) (make-posn (* 0.455 width) (* 0.485 height)) (make-posn (* 0.385 width) (* 0.480 height)) (make-posn (* 0.470 width) (* 0.340 height)) (make-posn (* 0.770 width) (* 0.535 height))))
(check-expect (cartesian->screen (make-world -2 2 -1 1) (list (make-posn 0 0) (make-posn 2 0) (make-posn -2 1))) (list (make-posn (/ width 2) (/ height 2)) (make-posn width (/ height 2)) (make-posn 0 0))) (check-expect (cartesian->screen (make-world -2 6 0 1) (list (make-posn 0 0) (make-posn 2 0) (make-posn -2 1))) (list (make-posn (/ width 4) height) (make-posn (/ width 2) height) (make-posn 0 0)))
For this exercise and the rest of this assignment, you might find the following picture helpful, but don’t worry about it if it doesn’t make sense to you.
Hint: To recall how to use map, review Lab 9: Built-in abstractions. Also, study the signature and purpose in Figure 95 of the textbook. What is X and what is Y?
5 Plotting graphs
To move and zoom the view, the user should change the World by pressing keys.
Exercise 8. Design a function navigate to be used as a big-bang key-event handler. Thus, navigate takes a World and a key event and returns a World. navigate enables 8 distinct keyboard-driven behaviors (aside from doing nothing at all).
The arrow keys will allow the user to move in four different directions in the scene. For example, the "down" key should subtract the same amount from both ymin and ymax. Because the view should never move by more than one screenful at a time, that amount should be something proportional to (- ymax ymin), such as (* speed (- ymax ymin)). Define the constant speed to be a number between 0.1 and 0.4, such as 0.2.
The keys "w", "a", "s" and "d" will allow the user to zoom in four ways: With respect to the x-axis, the "d" key will zoom in, and the "a" key will zoom out. With respect to the y-axis, the "w" key will zoom in, and the "s" key will zoom out. For example, the "w" key should add an amount to ymin and subtract the same amount from ymax. Because ymin should never exceed ymax, that amount should again be something proportional to (- ymax ymin), such as (* speed (- ymax ymin)).
6 Plotting functions
Now that we can plot a list of posns, let’s turn to plotting a graph. The y coordinates in a graph are obtained by feeding many x coordinates to the same function. The function must have the signature Number -> Number, like sqr and sin. So we need to generate many x coordinates, feed them to the same function to obtain y coordinates, and draw the resulting list of posns.
Exercise 10. Design a function xticks which takes three numbers xmin, xmax and n and produces an evenly spaced list of n numbers from xmin to xmax. The output list will be interpreted as x-values in the Cartesian coordinate system.
(xticks -2 2 (add1 width))
Use build-list and convert; do not use * /.
Hint: To recall how to use build-list, review the build-list section of Lecture 19: Using built-in abstractions. Also, study the signature and purpose in Figure 95 of the textbook. There, N means NaturalNumber. But what is X?
Exercise 12. Design a function draw-graph which takes a World and a function Number -> Number and produces its plot. draw-graph should be the composite of draw-lop, cartesian->screen, graph and xticks. Pass (add1 width) to xticks as the number of ticks to generate.
7 Challenge
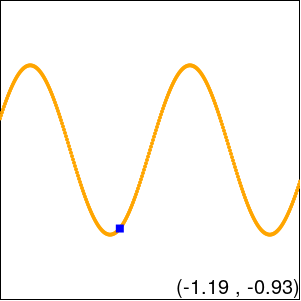
Exercise 14. Let’s give the user the ability to select a point in the graph of a function with the mouse and to see its coordinates. Specifically, when the user clicks on the plot with the mouse, a mark should appear corresponding to the point of the graph closest to location of the mouse event. Moreover, the program should display the Cartesian coordinates of the mark:
Here are a few suggestions. Extend the data definition of World to include a number representing the x-coordinate of the current mark (if there exists one) in Cartesian coordinates. This extra number will be updated on the mouse event “button-down”. The mouse-handler will therefore determine (via helpers) which point in the current graph is closest and extract its x-coordinate. Note that this means that the mouse-handler should be aware of the function being plotted: so just as draw-graph is parametrized by the function to be plotted, your mouse-handler should also be parametrized by the function to be plotted.
The coordinates should display as inexact numbers rounded to the nearest hundredth: exact->inexact, round, * and / are useful in achieving this.
Note: Extending the data definition of World will cause Handin to complain that your code doesn’t work properly. You can safely ignore these messages, but be forewarned that Handin will stop giving you useful feedback on the non-challenge problems once you start the challenge.